Python 绘制指数相关性热力图
韭菜的自我修养
数据获取
全部指数数据从中证指数公司获取
加载数据
使用pandas 解析所有excel, 保存每个指数对应的成分股的权重,数据中的一些指数只包含前十大权重股的权重,对这些指数中其他成分股的权重按照平均分配的方式设置。
load_xls.py
#-*- coding: utf-8 -*-
"""
File Name: load_xls.py
Author: ce39906
mail: ce39906@163.com
Created Time: 2019-03-01 11:35:07
"""
import pandas as pd
import numpy as np

def load_close_weight_xls(filename):
    print("loading ", filename)
    df = pd.read_excel(filename,
                       converters={'指数代码Index Code' : lambda x: str(x)})
    index_name = df['指数名称Index Name'].values[0]
    index_code = df['指数代码Index Code'].values[0]
    constituent_code = df['成分券代码Constituent Code'].values
    weight = df['权重(%)Weight(%)'].values

    n = weight.shape[0]
    constituent_code_2_weight = {}
    for i in range(n):
        constituent_code_2_weight[constituent_code[i]] = weight[i]
    return index_name, index_code, constituent_code_2_weight

def load_cons_xls(filename):
    print("loading ", filename)
    sheet1_df = pd.read_excel(filename,
                              converters={'指数代码Index Code' : lambda x: str(x)})
    index_name = sheet1_df['指数名称Index Name'].values[0]
    index_code = sheet1_df['指数代码Index Code'].values[0]
    constituent_code = sheet1_df['成分券代码Constituent Code'].values
    sheet2_df = pd.read_excel(filename, sheet_name='weight')
    top10_code_2_weight = {}
    for index, row in sheet2_df.iterrows():
        code = row['代码']
        weight = row['权重']
        top10_code_2_weight[code] = weight

    total_count = constituent_code.shape[0]
    top10_weight_count = len(top10_code_2_weight.keys())

    top10_weight_sum = 0.0
    for top10_weight in top10_code_2_weight.values():
        top10_weight_sum += top10_weight

    default_weight = (100.0 - top10_weight_sum) / (total_count - top10_weight_count)
    constituent_code_2_weight = {}
    for i in range(total_count):
        code = constituent_code[i]
        if code in top10_code_2_weight:
            constituent_code_2_weight[code] = top10_code_2_weight[code]
        else:
            constituent_code_2_weight[code] = default_weight
    return index_name, index_code, constituent_code_2_weigh
向量化以及绘制热力图
向量化的方式是统计出所有指数全部成分股作为向量的全部维度。
针对每个指数对应的向量,首先将向量值全部设置为0,然后在向量上为成分股对应的维度赋值。
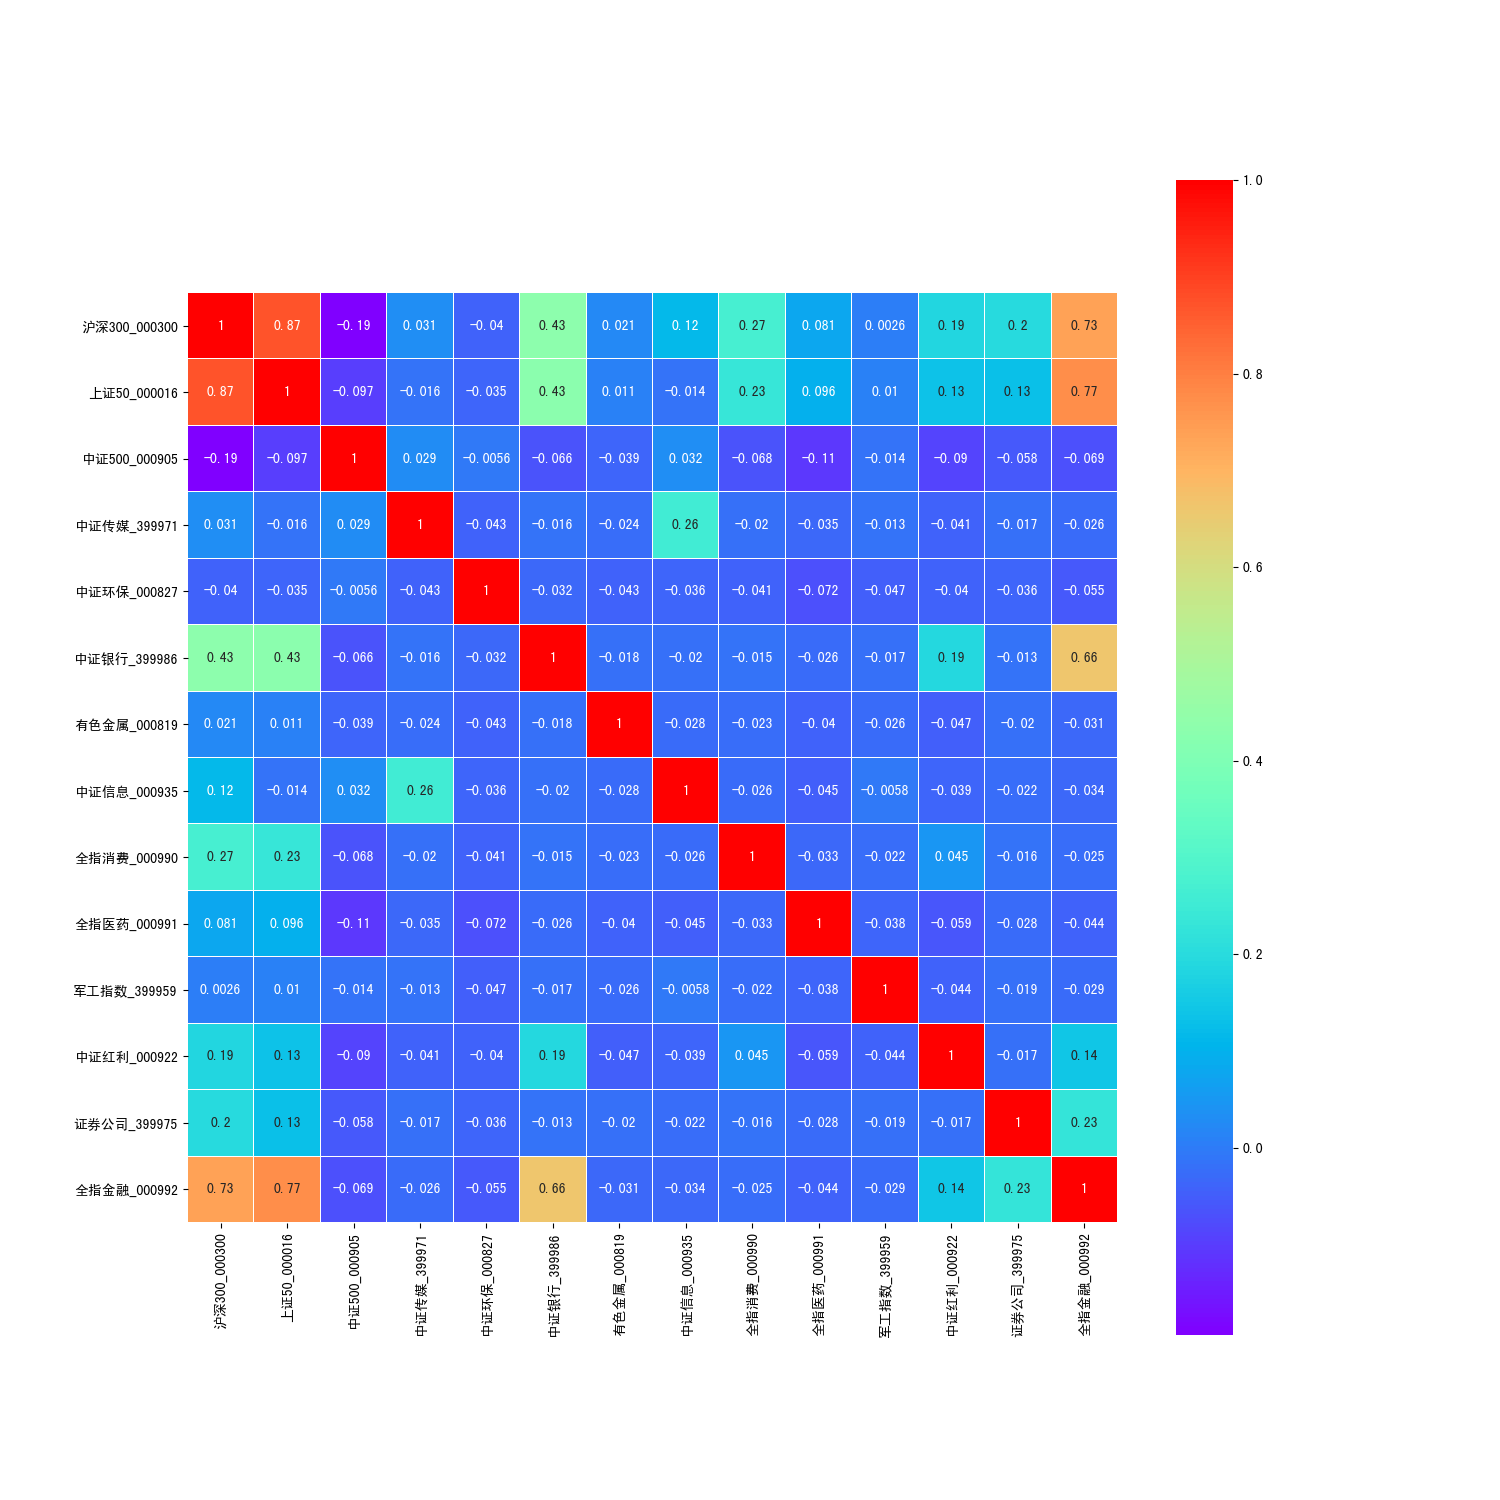
将每个指数都向量化后,合并到一个pandas dataframe中,dataframe中的每一列代表一个指数对应的向量。获取dataframe后使用**corr()**方法获得协方差矩阵,然后使用seaborn 绘制。
cal_stock_indices_correlation.py
#-*- coding: utf-8 -*-
"""
File Name: cal_stock_indices_correlation.py
Author: ce39906
mail: ce39906@163.com
Created Time: 2019-03-01 14:31:30
"""
import load_xls
import os
import pandas as pd
import numpy as np
import seaborn as sns
import matplotlib.pyplot as plt
plt.rcParams['font.sans-serif'] = ['SimHei']
plt.rcParams['axes.unicode_minus'] = False

def load_data():
    stock_indices_data = {}
    constituent_codes = set()

    for filename in os.listdir('data'):
        if not filename.endswith('.xls'):
            continue

        if len(filename) == 21:
            index_name, index_code, constituent_code_2_weight = load_xls.load_close_weight_xls('data/' + filename)
        else:
            index_name, index_code, constituent_code_2_weight = load_xls.load_cons_xls('data/' + filename)

        for constituent_code in constituent_code_2_weight.keys():
            constituent_codes.add(constituent_code)

        stock_indices_data[index_name + '_' + str(index_code)] = constituent_code_2_weight

    return list(constituent_codes), stock_indices_data

def vectorization(constituent_codes, stock_indices_data):
    n = len(constituent_codes)
    df = pd.DataFrame()
    for stock_index_name, weights in stock_indices_data.items():
        vector = [0.0] * n
        for i in range(n):
            code = constituent_codes[i]
            if code in weights:
                vector[i] = weights[code] / 100.0
        df[stock_index_name] = vector

    return df

def plot_corr_heatmap(df):
    corr = df.corr()
    f, ax = plt.subplots(figsize=(15, 15))
    sns.heatmap(corr,
                cmap='rainbow',
                linewidths=0.05,
                ax=ax,
                square=True,
                annot=True)
    f.savefig('stock_indices_corr_heatmap.png')

def main():
    constituent_codes, stock_indices_data = load_data()
    df = vectorization(constituent_codes, stock_indices_data)
    plot_corr_heatmap(df)

if __name__ == '__main__':
    main()
热力图